Tidy Tuesday Exercise

Tidy Tuesday:

The data this week comes from Hollywood Age Gap via Data Is Plural.

Data Wrangling and Explorations

library(ggplot2)
library(tidyverse)
── Attaching packages ─────────────────────────────────────── tidyverse 1.3.2 ──
✔ tibble  3.1.8      ✔ dplyr   1.0.10
✔ tidyr   1.3.0      ✔ stringr 1.5.0 
✔ readr   2.1.3      ✔ forcats 0.5.2 
✔ purrr   1.0.1      
── Conflicts ────────────────────────────────────────── tidyverse_conflicts() ──
✖ dplyr::filter() masks stats::filter()
✖ dplyr::lag()    masks stats::lag()

I wanted to make some new variables to assess the relationship types (man/man, woman/woman, or man/woman) and in the case of a man/woman relationship: who is older - the man or woman.

movies<- read_csv("movies.csv")
Rows: 1155 Columns: 12
── Column specification ────────────────────────────────────────────────────────
Delimiter: ","
chr  (7): Movie_Name, Director, Actor_1_Name, Actor_1_Gender, Actor_2_Name, ...
dbl  (4): Release_Year, Age_Difference, Actor_1_Age, Actor_2_Age
date (1): Actor_1_Birthdate

ℹ Use `spec()` to retrieve the full column specification for this data.
ℹ Specify the column types or set `show_col_types = FALSE` to quiet this message.
movies2 <- mutate(movies, couple_type = 
                    ifelse(Actor_1_Gender =='man' & Actor_2_Gender == 'woman' , "Man and Woman", 
                           ifelse (Actor_1_Gender == 'woman' & Actor_2_Gender == 'man',"Man and Woman", 
                                   ifelse (Actor_1_Gender =='man' & Actor_2_Gender == 'man',"Man and Man", 
                                           ifelse (Actor_1_Gender =='woman' & Actor_2_Gender == 'woman',"Woman and Woman",
                                                   "ERROR"))))) %>% mutate(older = 
            ifelse(couple_type != 'Man and Woman', 'Same Sex Couple',
               ifelse (Actor_1_Age > Actor_2_Age & Actor_1_Gender =='man', "Man",
                ifelse (Actor_1_Age > Actor_2_Age & Actor_1_Gender =='woman', "Woman",
                ifelse (Actor_2_Age > Actor_1_Age & Actor_2_Gender == 'man', 'Man',
                 ifelse (Actor_2_Age > Actor_1_Age & Actor_2_Gender == 'woman', "Woman",
                                    "Same Age")))))) %>% mutate(Age_Man =
  ifelse (Actor_1_Gender == 'man', Actor_1_Age, 
          ifelse (Actor_2_Gender =='man', Actor_2_Age, NA)))%>% 
  mutate(Age_Woman =ifelse (Actor_1_Gender == 'woman', Actor_1_Age, 
        ifelse (Actor_2_Gender =='woman', Actor_2_Age, NA)))

Next I wanted to look at the average age of the men and women in the movies, and how much older on average men and women are than their costar.

mean(movies2$Age_Man, na.rm=TRUE)
[1] 39.72203
mean(movies2$Age_Woman, na.rm=TRUE)
[1] 31.18985
movies2 %>% group_by(older) %>% summarise_at(vars(Age_Difference), list(name=mean))
# A tibble: 4 × 2
  older            name
  <chr>           <dbl>
1 Man             11.7 
2 Same Age         0   
3 Same Sex Couple 13.3 
4 Woman            5.50

What we found was…

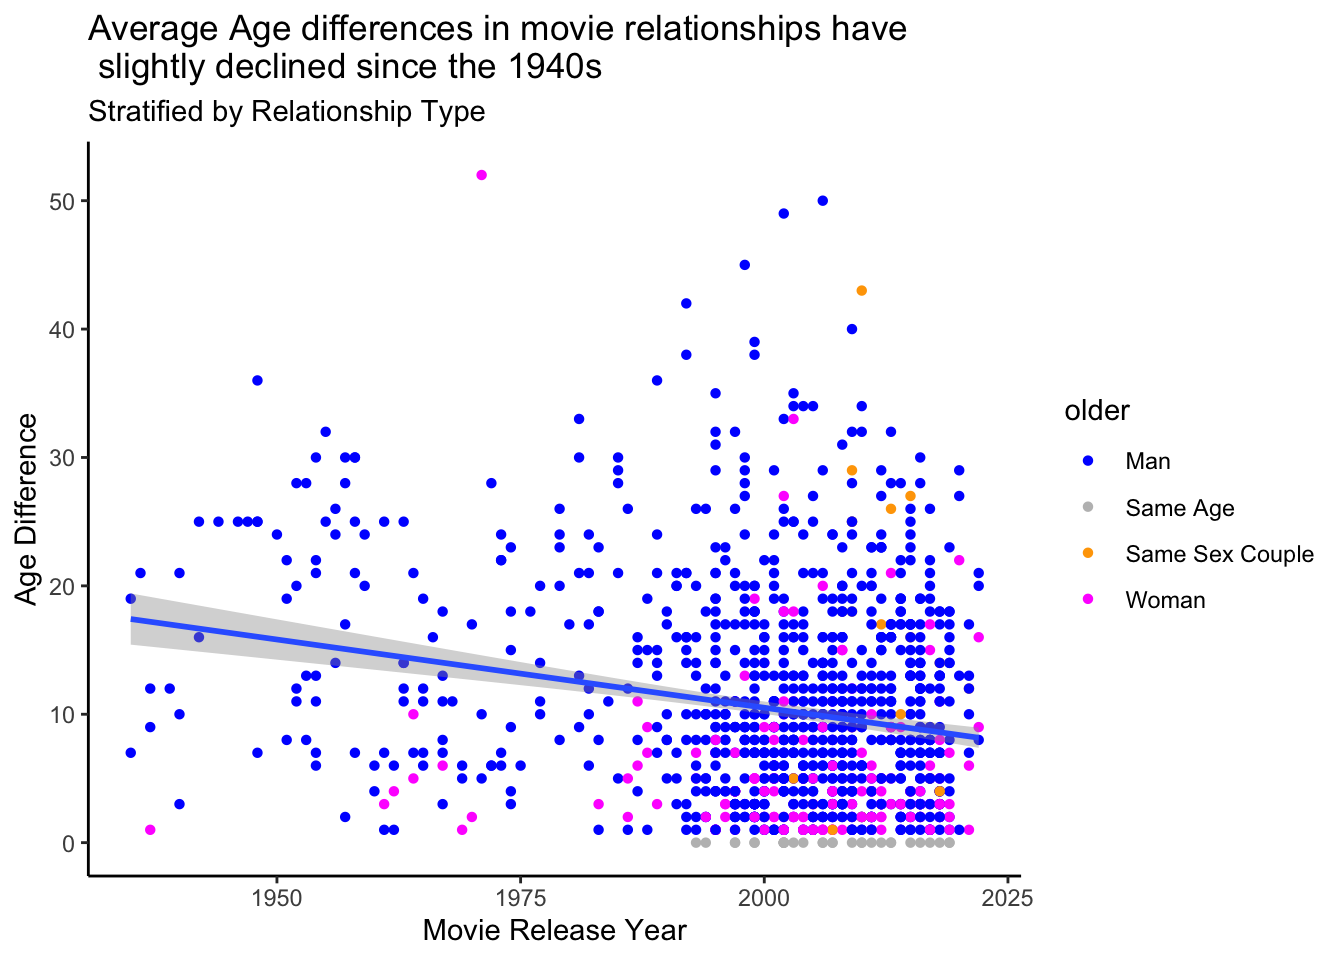
  • Men are the older partner in nearly 80% of movies (917 out of 1,132 movies with a man/woman relationship.

  • The average age difference when Men are older is men is 11.7 years

    • This is much higher than the average age difference of 5.5 years when women are older

    Let’s Make Some Plots

scatter_1 <- ggplot(data=movies2)+
  geom_point(aes(x=Release_Year, y=Age_Difference, color=older), shape = 16,
             size = 1.5) +
  theme_classic() + scale_color_manual(values = c("blue", "gray",
                                              "orange", "magenta")) +
labs(title="Average Age differences in movie relationships have\n slightly declined since the 1940s", 
subtitle="Stratified by Relationship Type",
x = "Movie Release Year", y = "Age Difference", legend="Who's Older?") +
  geom_smooth(aes(x=Release_Year, y=Age_Difference), 
                        method=lm)
scatter_1 
`geom_smooth()` using formula = 'y ~ x'
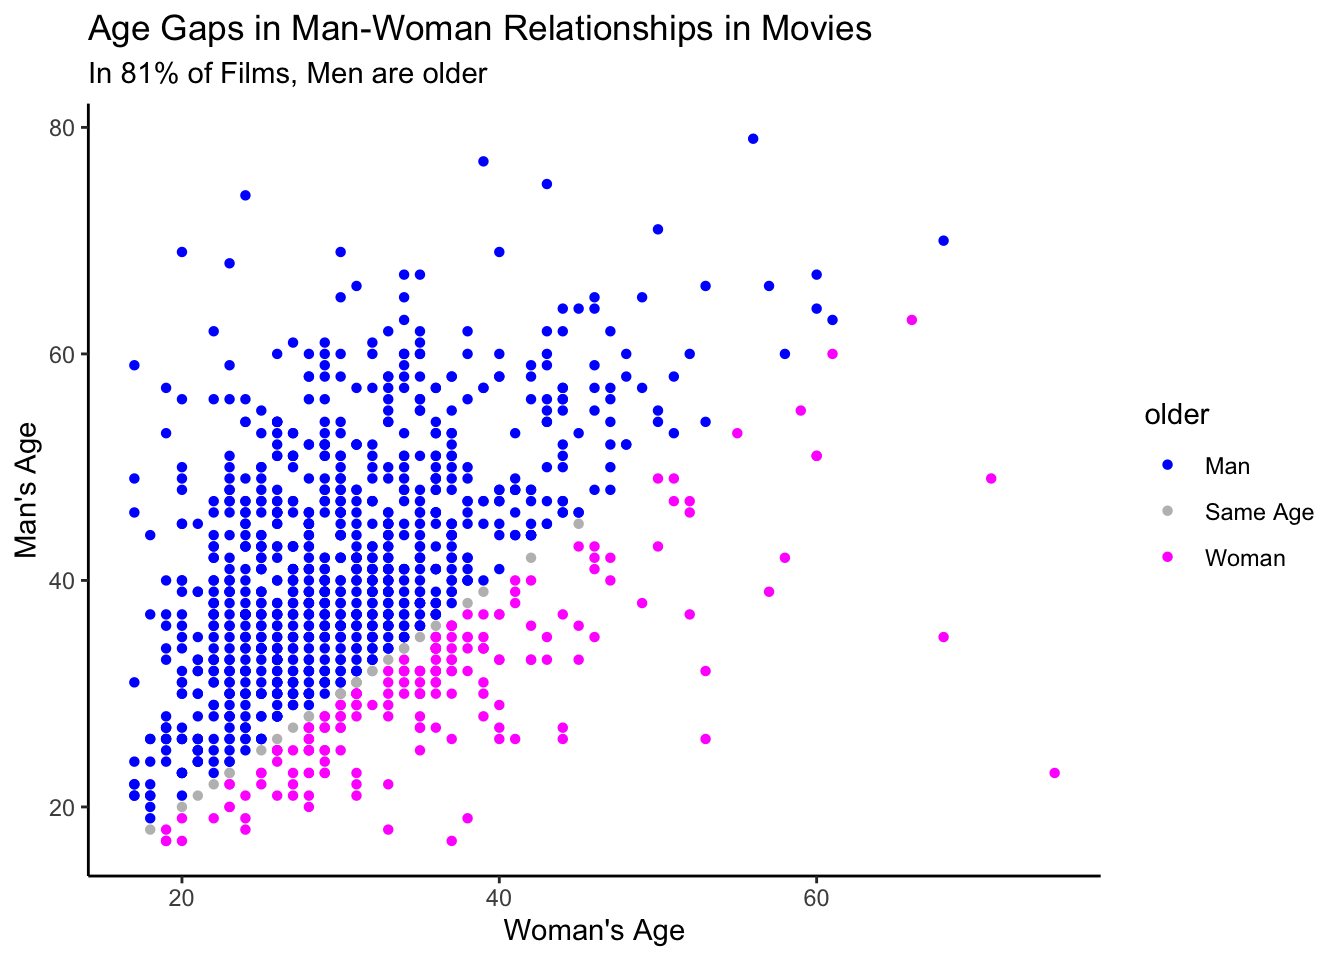
library(ggtext)
movies_sub <- subset(movies2, older != 'Same Sex Couple')
scatter_2 <- ggplot() + 
  geom_point(data=movies_sub, aes(x=Age_Woman, y=Age_Man, color=older), 
             shape = 16, size = 1.5) +
  scale_color_manual(values = c("blue", "gray", "magenta")) + 
  labs(title="Age Gaps in Man-Woman Relationships in Movies", 
  subtitle="In 81% of Films, Men are older", y= "Man's Age", x= "Woman's Age") +
  theme(plot.title = element_markdown(), 
        plot.subtitle=element_markdown(), legend.position="none") +
  theme_classic()
scatter_2

Relationships in movies feature extensive age gaps, and men remain older than their female love interests.

However, potential decreases in the age gap have been observed since 1940s. Also, there are some increasing numbers of same sex relationships being displayed in movies in more recent years too.