Identify Variables
here() starts at /Users/kellymccormickhatfield/Documents/MADA 2023/kellyhatfield-MADA-portfolio
── Attaching packages
───────────────────────────────────────
tidyverse 1.3.2 ──
✔ ggplot2 3.4.0      ✔ purrr   1.0.1
✔ tibble  3.1.8      ✔ dplyr   1.0.10
✔ tidyr   1.3.0      ✔ stringr 1.5.0
✔ readr   2.1.3      ✔ forcats 0.5.2
── Conflicts ────────────────────────────────────────── tidyverse_conflicts() ──
✖ dplyr::filter() masks stats::filter()
✖ dplyr::lag()    masks stats::lag()
── Attaching packages ────────────────────────────────────── tidymodels 1.0.0 ──
✔ broom        1.0.2     ✔ rsample      1.1.1
✔ dials        1.1.0     ✔ tune         1.0.1
✔ infer        1.0.4     ✔ workflows    1.1.2
✔ modeldata    1.0.1     ✔ workflowsets 1.0.0
✔ parsnip      1.0.3     ✔ yardstick    1.1.0
✔ recipes      1.0.4
── Conflicts ───────────────────────────────────────── tidymodels_conflicts() ──
✖ scales::discard() masks purrr::discard()
✖ dplyr::filter()   masks stats::filter()
✖ recipes::fixed()  masks stringr::fixed()
✖ dplyr::lag()      masks stats::lag()
✖ yardstick::spec() masks readr::spec()
✖ recipes::step()   masks stats::step()
• Learn how to get started at https://www.tidymodels.org/start/
<- readRDS ("~/Documents/MADA 2023/kellyhatfield-MADA-portfolio/fluanalysis/Data/CleanSymp.Rds" )ls (CleanSymp)
 [1] "AbPain"            "BodyTemp"          "Breathless"
 [4] "ChestCongestion"   "ChestPain"         "ChillsSweats"
 [7] "CoughIntensity"    "CoughYN"           "CoughYN2"
[10] "Diarrhea"          "EarPn"             "EyePn"
[13] "Fatigue"           "Headache"          "Hearing"
[16] "Insomnia"          "ItchyEye"          "Myalgia"
[19] "MyalgiaYN"         "NasalCongestion"   "Nausea"
[22] "Pharyngitis"       "RunnyNose"         "Sneeze"
[25] "SubjectiveFever"   "SwollenLymphNodes" "ToothPn"
[28] "Vision"            "Vomit"             "Weakness"
[31] "WeaknessYN"        "Wheeze"
 SwollenLymphNodes ChestCongestion ChillsSweats NasalCongestion CoughYN
 No :418           No :323         No :130      No :167         No : 75
 Yes:312           Yes:407         Yes:600      Yes:563         Yes:655


 Sneeze    Fatigue   SubjectiveFever Headache      Weakness   WeaknessYN
 No :339   No : 64   No :230         No :115   None    : 49   No : 49
 Yes:391   Yes:666   Yes:500         Yes:615   Mild    :223   Yes:681
                                               Moderate:338
                                               Severe  :120


  CoughIntensity CoughYN2      Myalgia    MyalgiaYN RunnyNose AbPain
 None    : 47    No : 47   None    : 79   No : 79   No :211   No :639
 Mild    :154    Yes:683   Mild    :213   Yes:651   Yes:519   Yes: 91
 Moderate:357              Moderate:325
 Severe  :172              Severe  :113


 ChestPain Diarrhea  EyePn     Insomnia  ItchyEye  Nausea    EarPn
 No :497   No :631   No :617   No :315   No :551   No :475   No :568
 Yes:233   Yes: 99   Yes:113   Yes:415   Yes:179   Yes:255   Yes:162


 Hearing   Pharyngitis Breathless ToothPn   Vision    Vomit     Wheeze
 No :700   No :119     No :436    No :565   No :711   No :652   No :510
 Yes: 30   Yes:611     Yes:294    Yes:165   Yes: 19   Yes: 78   Yes:220


    BodyTemp
 Min.   : 97.20
 1st Qu.: 98.20
 Median : 98.50
 Mean   : 98.94
 3rd Qu.: 99.30
 Max.   :103.10
Things to note:
Most variables are categorical Yes/No.
Temperature is continuous from 97.2 to 103.1
Weakness, CoughIntensity, and Myalgia are scored None, Mild, Moderate, Severe
MyalgiaYN, CoughYN2, and WeaknessYN are all Yes/No versions of their corresponding intensity variable (None, Mild, Moderate, Severe)
Data Explorations: Body Temperature
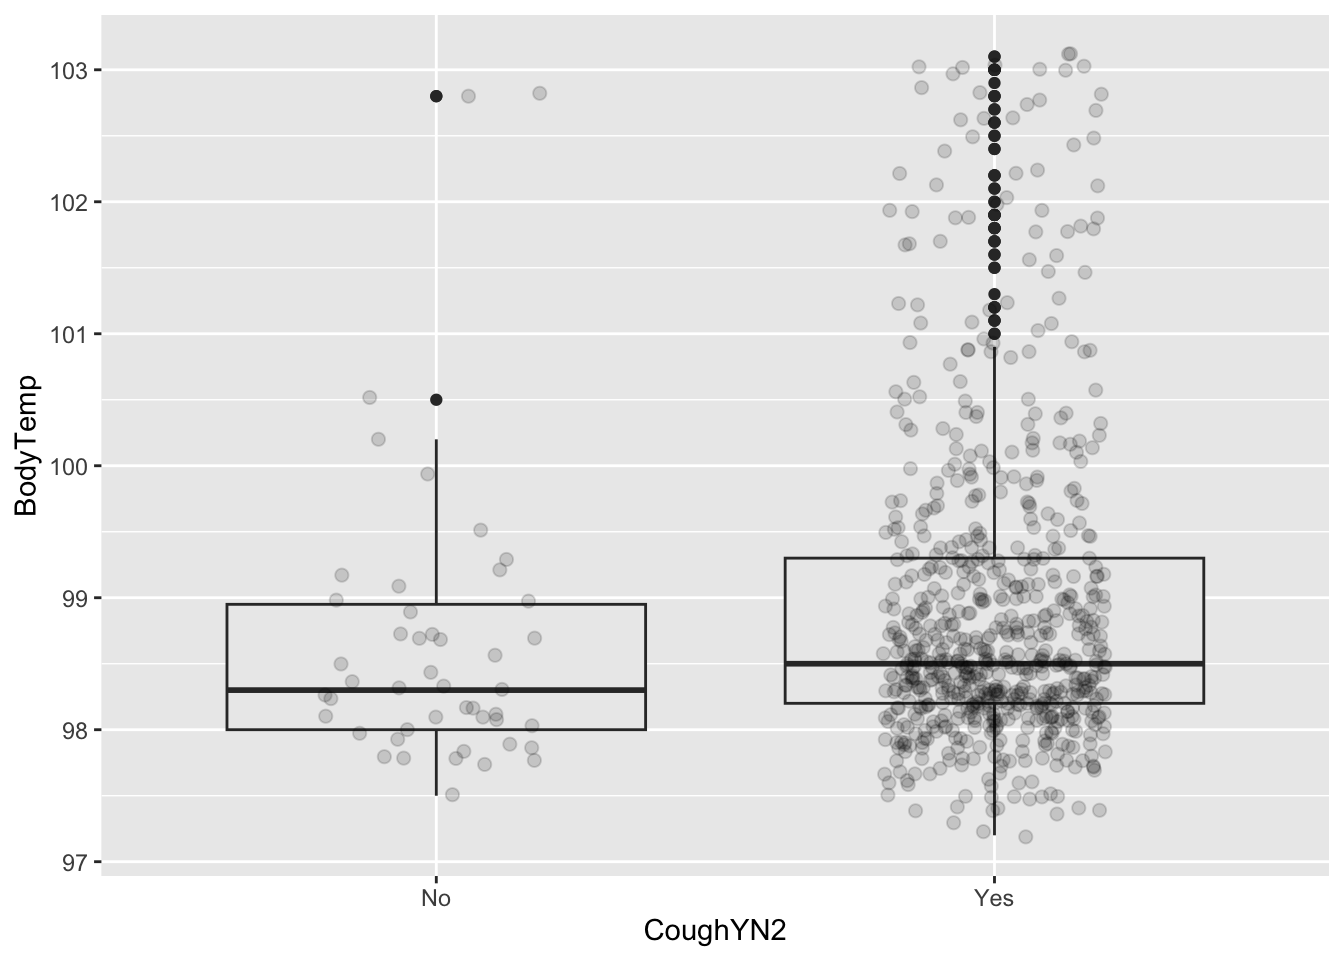
First, we want to look at temperature with a few key variables. We have selected cough, chest pain and wheeze.
%>% summarize (min= min (BodyTemp),mean= mean (BodyTemp), q1 = quantile (BodyTemp, 0.25 ), median = mean (BodyTemp), q3 = quantile (BodyTemp, 0.75 ), max= max (BodyTemp))
   min     mean   q1   median   q3   max
1 97.2 98.93507 98.2 98.93507 99.3 103.1
%>% group_by (CoughYN2) %>% summarize (mean= mean (BodyTemp), q1 = quantile (BodyTemp, 0.25 ), median = mean (BodyTemp), q3 = quantile (BodyTemp, 0.75 ))
# A tibble: 2 × 5
  CoughYN2  mean    q1 median    q3
  <fct>    <dbl> <dbl>  <dbl> <dbl>
1 No        98.7  98     98.7  99.0
2 Yes       99.0  98.2   99.0  99.3
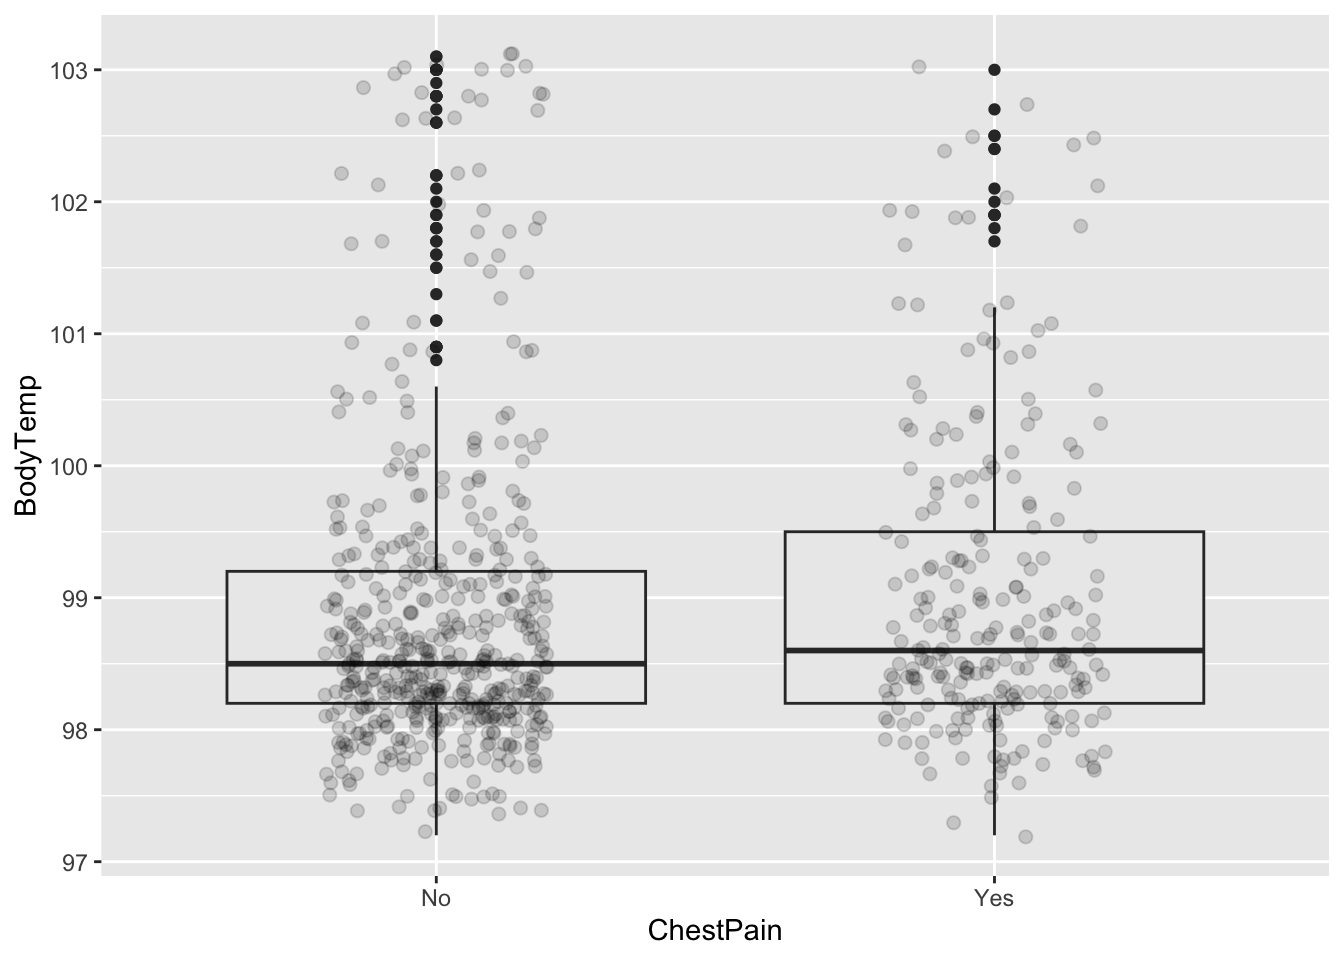
ggplot (CleanSymp, aes (x = CoughYN2, y = BodyTemp)) + geom_boxplot (fill = "grey92" ) + geom_point (size = 2 , alpha = .15 ,position = position_jitter (seed = 1 , width = .2 )) %>% group_by (ChestPain) %>% summarize (mean= mean (BodyTemp), q1 = quantile (BodyTemp, 0.25 ), median = median (BodyTemp), q3 = quantile (BodyTemp, 0.75 ))
# A tibble: 2 × 5
  ChestPain  mean    q1 median    q3
  <fct>     <dbl> <dbl>  <dbl> <dbl>
1 No         98.9  98.2   98.5  99.2
2 Yes        99.0  98.2   98.6  99.5
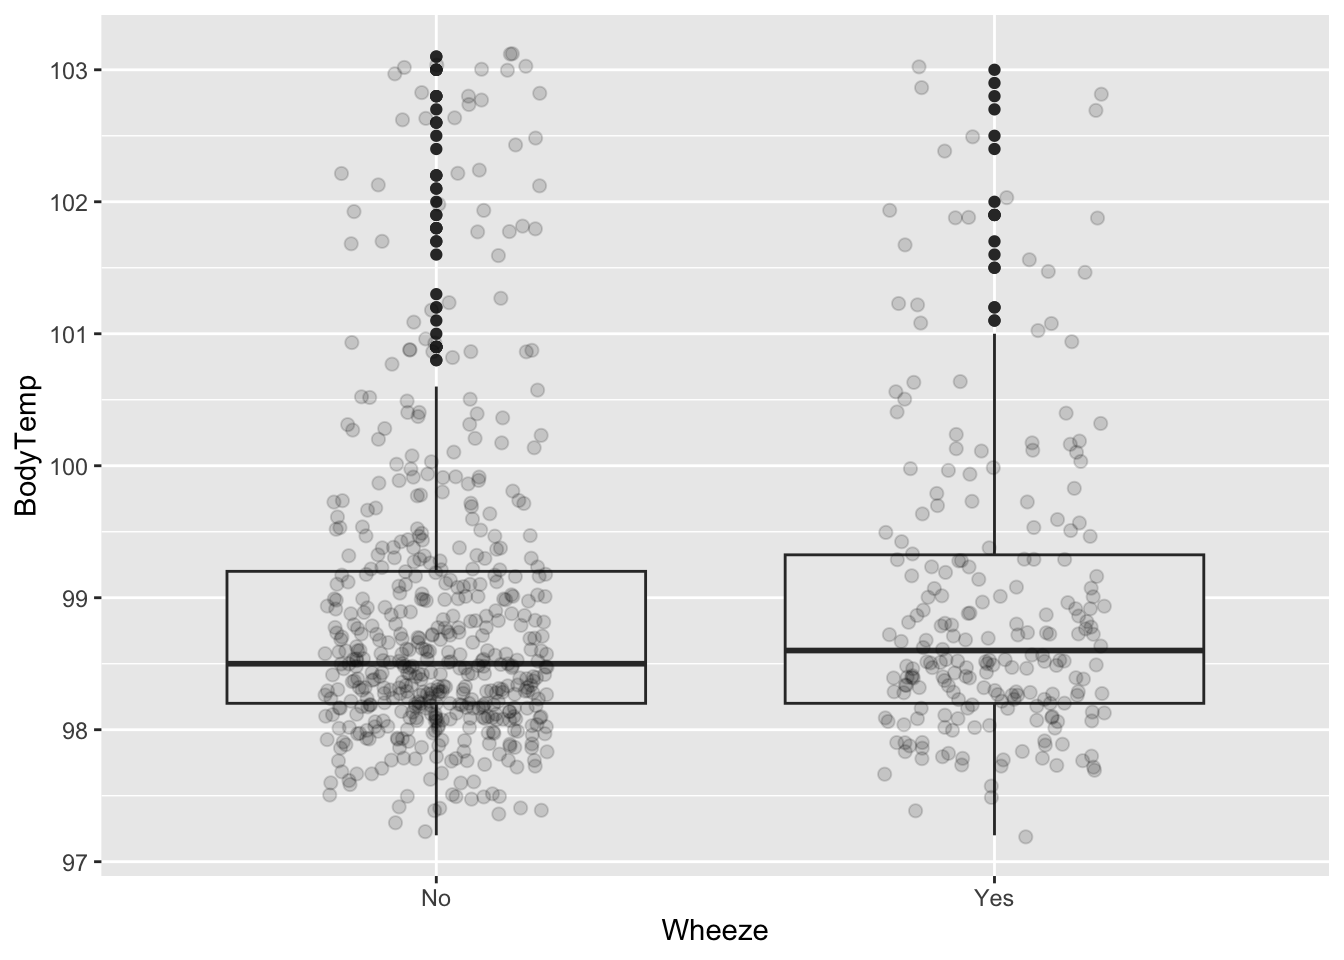
ggplot (CleanSymp, aes (x = ChestPain, y = BodyTemp)) + geom_boxplot (fill = "grey92" ) + geom_point (size = 2 , alpha = .15 ,position = position_jitter (seed = 1 , width = .2 )) %>% group_by (Wheeze) %>% summarize (mean= mean (BodyTemp), q1 = quantile (BodyTemp, 0.25 ), median = median (BodyTemp), q3 = quantile (BodyTemp, 0.75 ))
# A tibble: 2 × 5
  Wheeze  mean    q1 median    q3
  <fct>  <dbl> <dbl>  <dbl> <dbl>
1 No      98.9  98.2   98.5  99.2
2 Yes     99.0  98.2   98.6  99.3
ggplot (CleanSymp, aes (x = Wheeze, y = BodyTemp)) + geom_boxplot (fill = "grey92" ) + geom_point (size = 2 , alpha = .15 ,position = position_jitter (seed = 1 , width = .2 ))
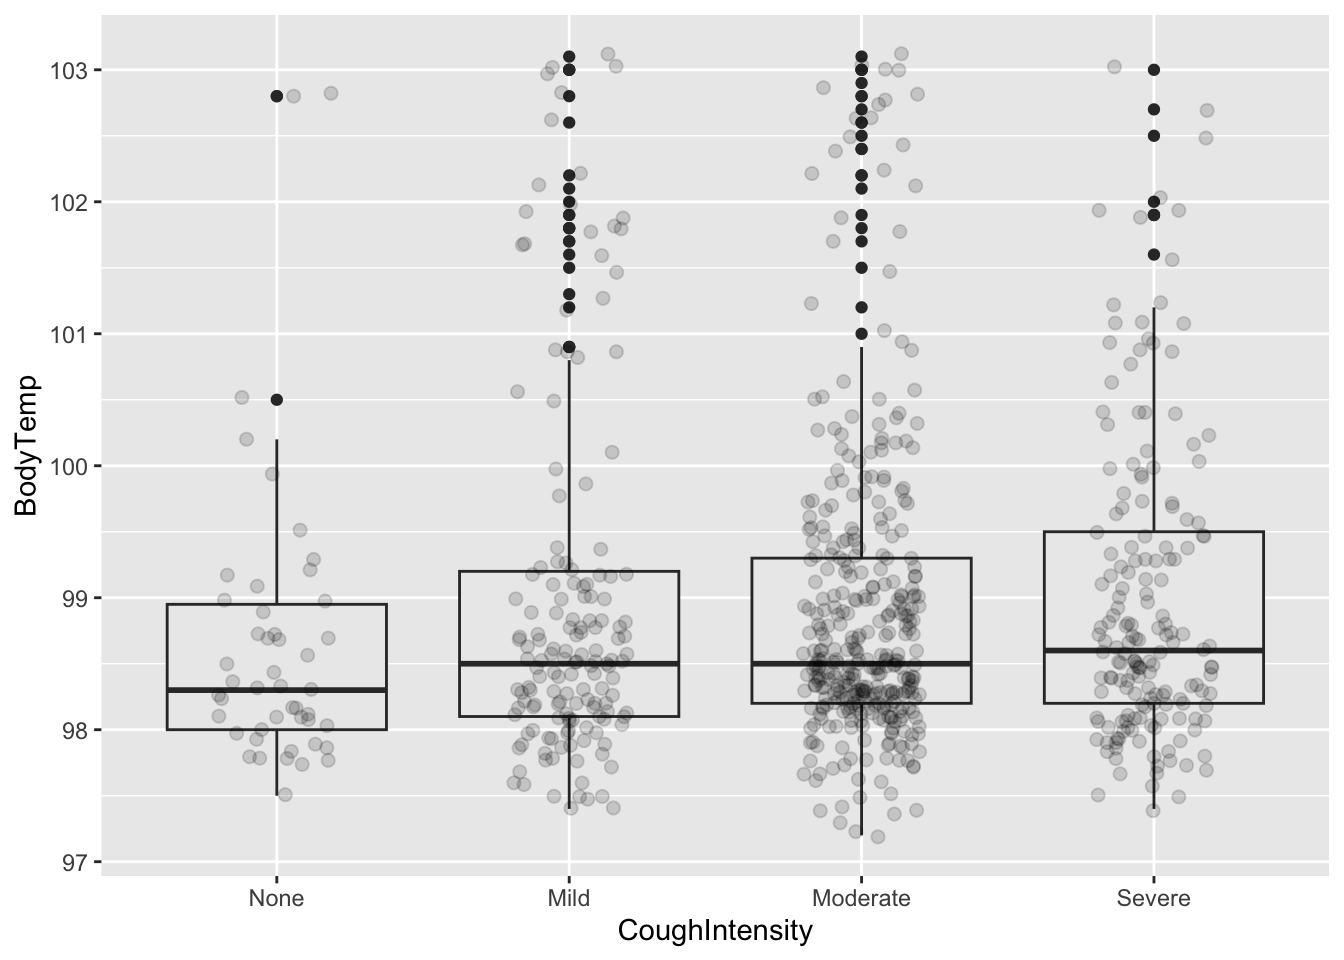
Since median teperature seems to be slightly elevated for the cough variable, we will look at it further for those varying rankings of the intensity of the cough.
%>% group_by (CoughIntensity) %>% summarize (mean= mean (BodyTemp), q1 = quantile (BodyTemp, 0.25 ), median = median (BodyTemp), q3 = quantile (BodyTemp, 0.75 ))
# A tibble: 4 × 5
  CoughIntensity  mean    q1 median    q3
  <fct>          <dbl> <dbl>  <dbl> <dbl>
1 None            98.7  98     98.3  99.0
2 Mild            99    98.1   98.5  99.2
3 Moderate        98.9  98.2   98.5  99.3
4 Severe          99.0  98.2   98.6  99.5
ggplot (CleanSymp, aes (x = CoughIntensity, y = BodyTemp)) + geom_boxplot (fill = "grey92" ) + geom_point (size = 2 , alpha = .15 ,position = position_jitter (seed = 1 , width = .2 ))
The mean body temperature doesn’t seem to vary too much by increasing cough intensity group. However, perhaps some increase in median or q3 values.
Data Explorations: Nausea
For nausea we have decided to assess the relationship of nausea with subjective fever, myalgia, and abdominal pain.
# Variables of interest with Nausea <- table (CleanSymp$ Nausea,CleanSymp$ SubjectiveFever)
       No Yes
  No  166 309
  Yes  64 191
prop.table (table1) %>% {.* 100 } %>% round (2 )
         No   Yes
  No  22.74 42.33
  Yes  8.77 26.16
<- table (CleanSymp$ Nausea,CleanSymp$ MyalgiaYN)
       No Yes
  No   63 412
  Yes  16 239
prop.table (table2) %>% {.* 100 } %>% round (2 )
         No   Yes
  No   8.63 56.44
  Yes  2.19 32.74
<- table (CleanSymp$ Nausea,CleanSymp$ AbPain)
       No Yes
  No  444  31
  Yes 195  60
prop.table (table3) %>% {.* 100 } %>% round (2 )
         No   Yes
  No  60.82  4.25
  Yes 26.71  8.22
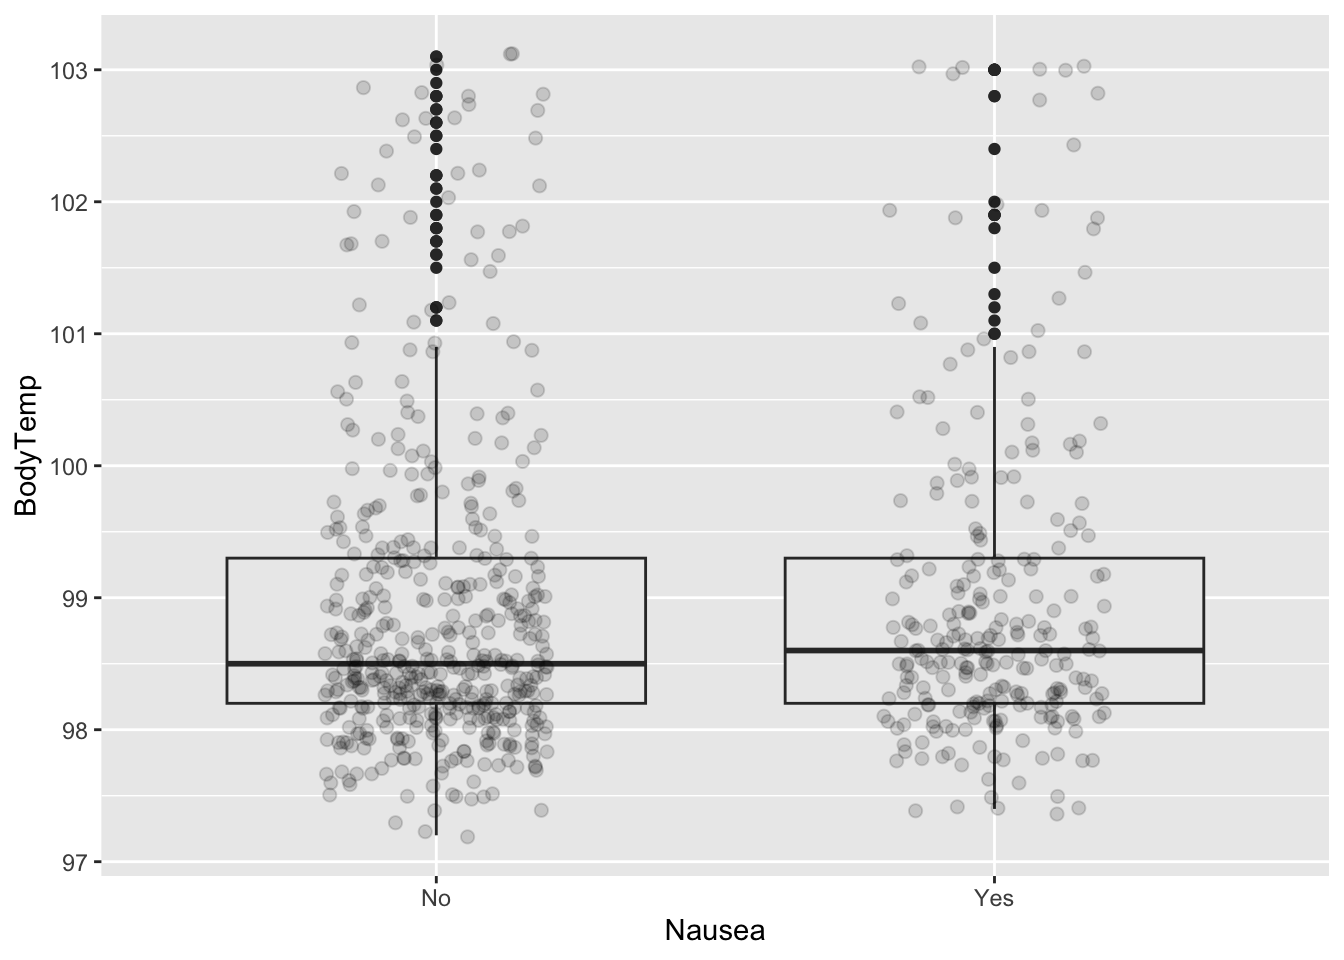
Data Explorations: Nausea and Body Temp
FFinally lets look at the relationships between our two primary variables.
%>% group_by (Nausea) %>% summarize (mean= mean (BodyTemp), q1 = quantile (BodyTemp, 0.25 ), median = median (BodyTemp), q3 = quantile (BodyTemp, 0.75 ))
# A tibble: 2 × 5
  Nausea  mean    q1 median    q3
  <fct>  <dbl> <dbl>  <dbl> <dbl>
1 No      98.9  98.2   98.5  99.3
2 Yes     99.0  98.2   98.6  99.3
ggplot (CleanSymp, aes (x = Nausea, y = BodyTemp)) + geom_boxplot (fill = "grey92" ) + geom_point (size = 2 , alpha = .15 ,position = position_jitter (seed = 1 , width = .2 ))